Hot US Stocks
Derived from the 50 most active stocks priced over $5 listed on any U.S. Exchange (NYSE, Nasdaq, OTCBB, etc.). The default setting shows stocks starting from $5.00, however any minimum and maximum price can be entered by specifying the price range below and clicking on the go button.
Min Price:
Max Price:
| Chart | Company Name | Volume | Price | High | Low | Open | Change | BI Rating |
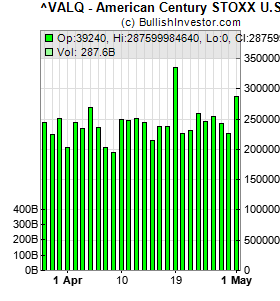 ^VALQ
^VALQ
| American Century STOXX U.S. Quality Value ETF | 334,653,437,422 | $334653437000 | $334653437000 | $0 | $1051 |
40.97%
|

|
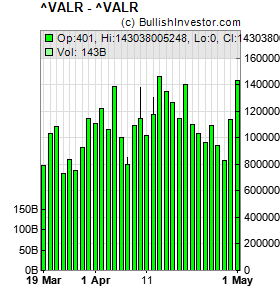 ^VALR
^VALR
| ^VALR | 140,114,800,755 | $140114800000 | $140114800000 | $0 | $16449 |
21.96%
|
|
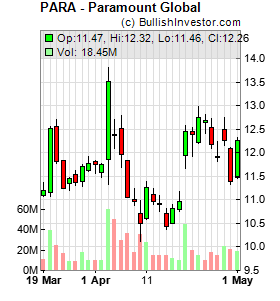 PARA
PARA
| Paramount Global | 44,761,642 | $12.44 | $12.58 | $11.67 | $11.94 |
13.40%
|

|
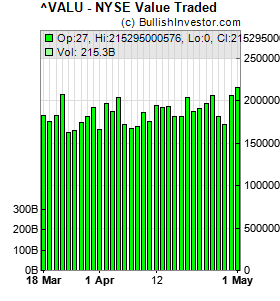 ^VALU
^VALU
| NYSE Value Traded | 203,929,480,463 | $203929480000 | $203929480000 | $0 | $8624 |
12.15%
|
|
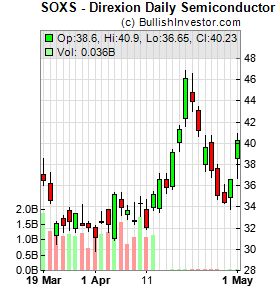 SOXS
SOXS
| Direxion Daily Semiconductor Bear 3X Shares | 32,305,961 | $46.13 | $46.84 | $41.625 | $42.37 |
11.78%
|
|
 ^VOLR
^VOLR
| ^VOLR | 1,705,899,253 | $1705899 | $1705899 | $0 | $0.003 |
11.60%
|
|
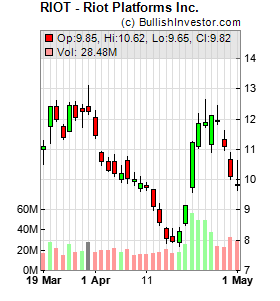 RIOT
RIOT
| Riot Platforms Inc. | 25,364,987 | $9.13 | $9.15 | $8.48 | $8.55 |
10.13%
|
|
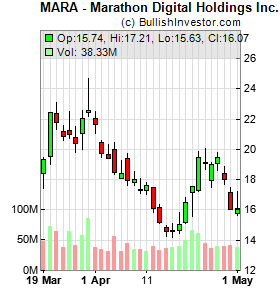 MARA
MARA
| Marathon Digital Holdings Inc. | 49,599,266 | $16.5 | $16.85 | $15.1 | $15.16 |
9.78%
|

|
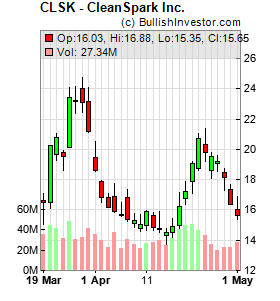 CLSK
CLSK
| CleanSpark Inc. | 44,501,437 | $17.2 | $17.9 | $16.37 | $16.73 |
5.98%
|
|
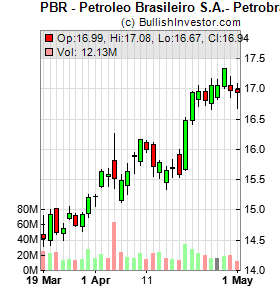 PBR
PBR
| Petroleo Brasileiro S.A.- Petrobras | 34,286,781 | $16.47 | $16.525 | $15.645 | $15.66 |
5.71%
|
|
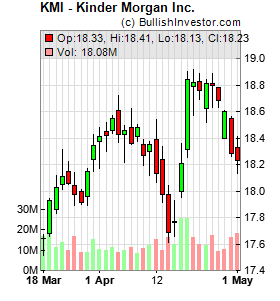 KMI
KMI
| Kinder Morgan Inc. | 25,410,416 | $18.84 | $18.9 | $18.255 | $18.31 |
3.46%
|
|
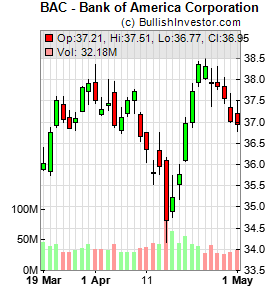 BAC
BAC
| Bank of America Corporation | 55,888,310 | $36.97 | $37.12 | $36.06 | $36.1 |
3.35%
|
|
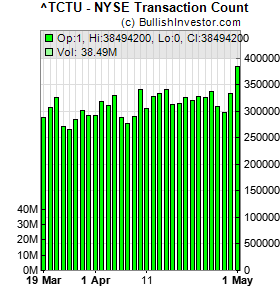 ^TCTU
^TCTU
| NYSE Transaction Count | 32,610,949 | $32610949 | $32610949 | $0 | $1 |
3.28%
|
|
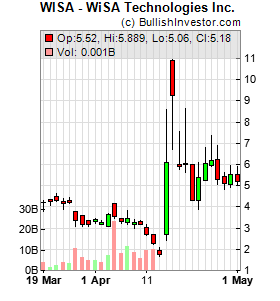 WISA
WISA
| WiSA Technologies Inc. | 35,199,369 | $6.06 | $8.64 | $5.609 | $5.99 |
2.89%
|
|
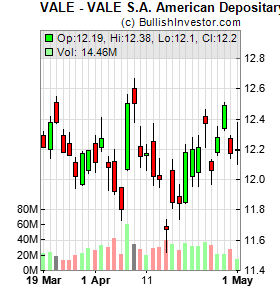 VALE
VALE
| VALE S.A. American Depositary Shares Each Representing one | 34,803,530 | $12.18 | $12.23 | $11.84 | $11.85 |
2.87%
|
|
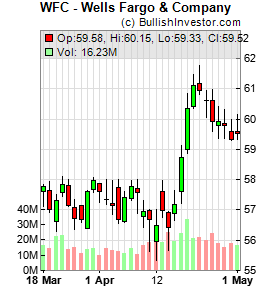 WFC
WFC
| Wells Fargo & Company | 33,465,747 | $60.35 | $60.85 | $58.855 | $59 |
2.74%
|
|
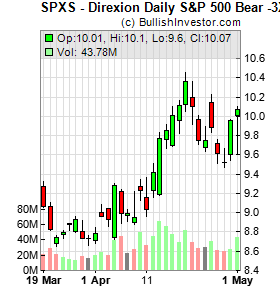 SPXS
SPXS
| Direxion Daily S&P 500 Bear -3X Shares | 52,048,610 | $10.36 | $10.45 | $10.05 | $10.12 |
2.47%
|
|
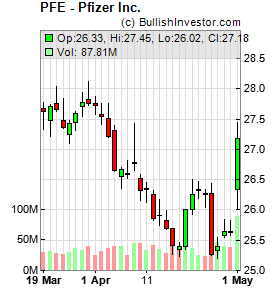 PFE
PFE
| Pfizer Inc. | 37,887,627 | $26 | $26 | $25.35 | $25.39 |
2.40%
|
|
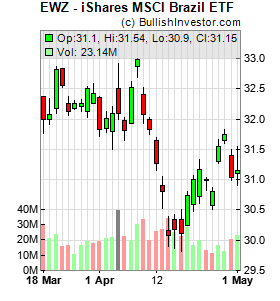 EWZ
EWZ
| iShares MSCI Brazil ETF | 28,331,464 | $30.74 | $30.805 | $30.235 | $30.24 |
2.09%
|
|
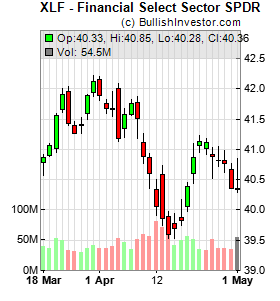 XLF
XLF
| Financial Select Sector SPDR | 55,339,448 | $40.38 | $40.455 | $39.97 | $40.05 |
1.38%
|
|
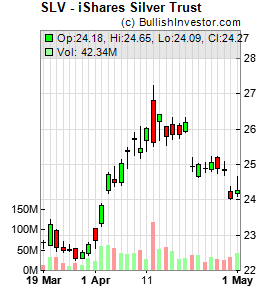 SLV
SLV
| iShares Silver Trust | 29,236,904 | $26.2 | $26.3203 | $25.9044 | $25.93 |
1.31%
|
|
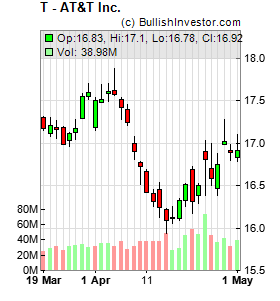 T
T
| AT&T Inc. | 45,769,160 | $16.51 | $16.525 | $16.26 | $16.33 |
1.10%
|
|
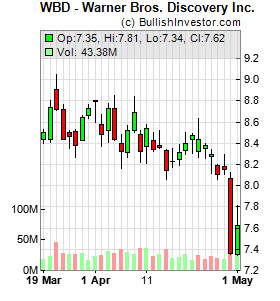 WBD
WBD
| Warner Bros. Discovery Inc. | 26,054,132 | $8.4 | $8.5 | $8.29 | $8.33 |
1.08%
|
|
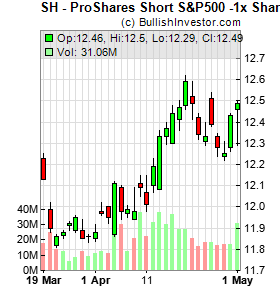 SH
SH
| ProShares Short S&P500 -1x Shares | 26,600,033 | $12.59 | $12.62 | $12.46 | $12.48 |
0.96%
|
|
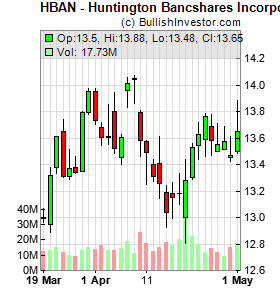 HBAN
HBAN
| Huntington Bancshares Incorporated | 39,322,059 | $13.28 | $13.44 | $12.8 | $13 |
0.76%
|
|
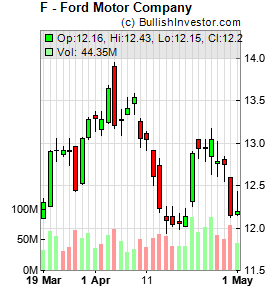 F
F
| Ford Motor Company | 39,355,351 | $12.14 | $12.23 | $12.02 | $12.02 |
0.66%
|
|
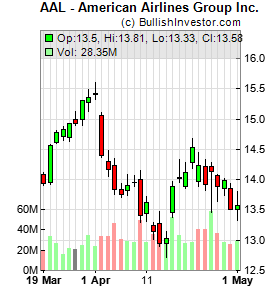 AAL
AAL
| American Airlines Group Inc. | 27,039,186 | $14.11 | $14.275 | $13.86 | $13.88 |
0.64%
|
|
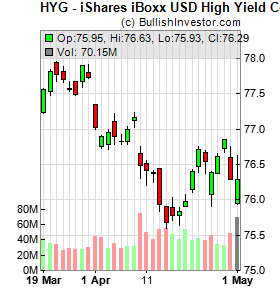 HYG
HYG
| iShares iBoxx USD High Yield Corporate Bond ETF | 53,194,415 | $75.98 | $76.08 | $75.9 | $75.91 |
0.18%
|
|
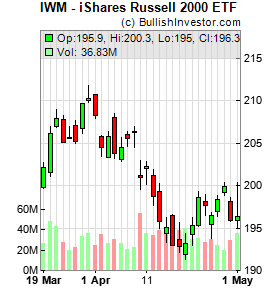 IWM
IWM
| iShares Russell 2000 ETF | 41,737,598 | $193.14 | $194.39 | $191.34 | $191.94 |
0.16%
|
|
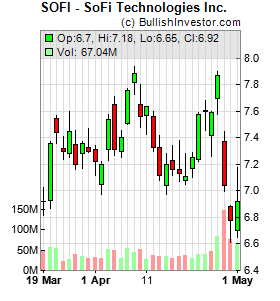 SOFI
SOFI
| SoFi Technologies Inc. | 36,364,890 | $7.11 | $7.28 | $7.05 | $7.08 |
-0.28%
|
|
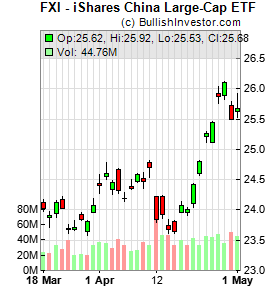 FXI
FXI
| iShares China Large-Cap ETF | 32,203,704 | $24.01 | $24.045 | $23.9 | $23.95 |
-0.29%
|
|
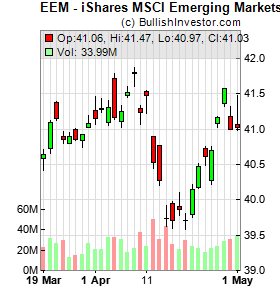 EEM
EEM
| iShares MSCI Emerging Markets ETF | 29,179,836 | $39.71 | $39.805 | $39.5817 | $39.71 |
-0.40%
|
|
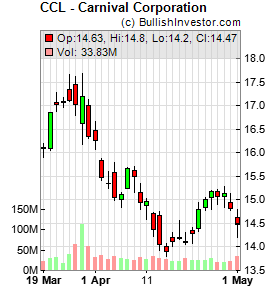 CCL
CCL
| Carnival Corporation | 29,300,435 | $14.12 | $14.31 | $14.05 | $14.1 |
-0.42%
|

|
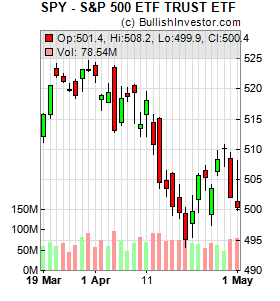 SPY
SPY
| S&P 500 ETF TRUST ETF | 100,912,759 | $495.16 | $500.455 | $493.86 | $499.44 |
-0.87%
|
|
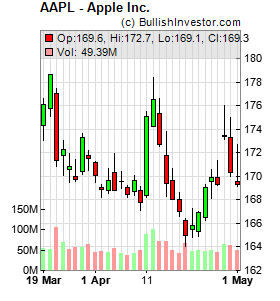 AAPL
AAPL
| Apple Inc. | 65,748,221 | $165 | $166.4 | $164.075 | $166.21 |
-1.22%
|
|
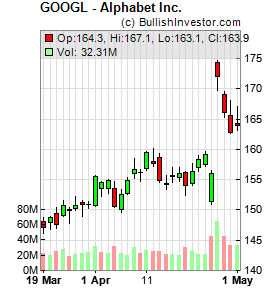 GOOGL
GOOGL
| Alphabet Inc. | 30,802,528 | $154.09 | $156.36 | $152.3 | $156.2 |
-1.23%
|
|
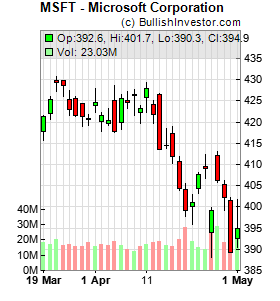 MSFT
MSFT
| Microsoft Corporation | 28,195,505 | $399.12 | $405.48 | $397.77 | $404.03 |
-1.27%
|
|
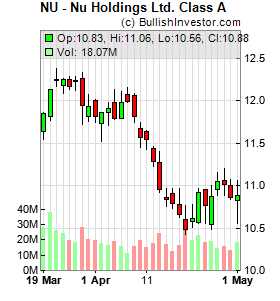 NU
NU
| Nu Holdings Ltd. Class A | 26,656,473 | $10.48 | $10.77 | $10.43 | $10.6 |
-1.69%
|
|
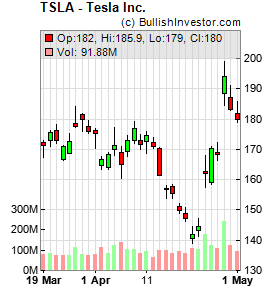 TSLA
TSLA
| Tesla Inc. | 85,768,838 | $147.05 | $150.94 | $146.22 | $148.97 |
-1.92%
|
|
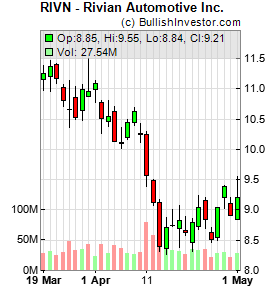 RIVN
RIVN
| Rivian Automotive Inc. | 26,343,600 | $8.63 | $8.89 | $8.57 | $8.66 |
-2.27%
|
|
 INTC
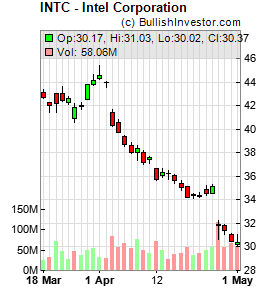
INTC
| Intel Corporation | 57,054,462 | $34.2 | $35.13 | $34.18 | $35.13 |
-2.40%
|
|
 AMZN
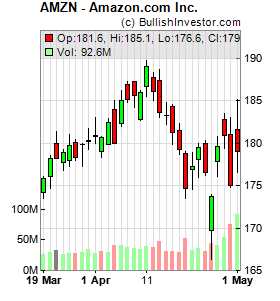
AMZN
| Amazon.com Inc. | 52,668,161 | $174.63 | $179 | $173.44 | $178.74 |
-2.56%
|
|
 PLTR
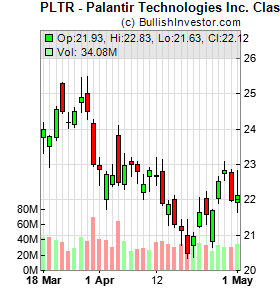
PLTR
| Palantir Technologies Inc. Class A | 39,260,716 | $20.47 | $21.43 | $20.33 | $20.98 |
-3.12%
|
|
 TSM
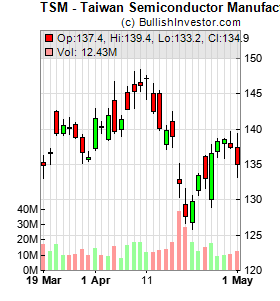
TSM
| Taiwan Semiconductor Manufacturing Company Ltd. | 28,026,263 | $127.7 | $131.55 | $126.64 | $129.37 |
-3.46%
|
|
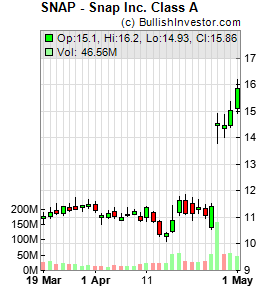 SNAP
SNAP
| Snap Inc. Class A | 30,204,239 | $11.16 | $11.88 | $11.115 | $11.65 |
-4.04%
|
|
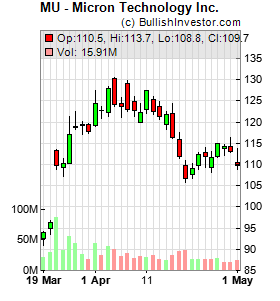 MU
MU
| Micron Technology Inc. | 33,117,213 | $106.77 | $110.88 | $105.72 | $109.66 |
-4.61%
|
|
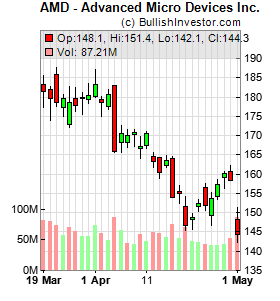 AMD
AMD
| Advanced Micro Devices Inc. | 70,075,422 | $146.64 | $154.25 | $145.29 | $151.59 |
-5.44%
|
|
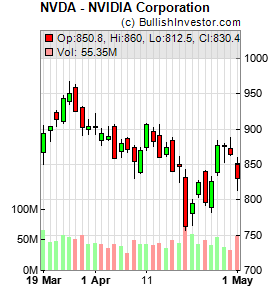 NVDA
NVDA
| NVIDIA Corporation | 85,751,855 | $762 | $843.24 | $756.06 | $831.5 |
-10.00%
|
|
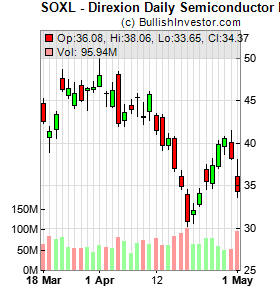 SOXL
SOXL
| Direxion Daily Semiconductor Bull 3X Shares | 103,698,755 | $30.79 | $34.58 | $30.2 | $33.96 |
-11.80%
|
|
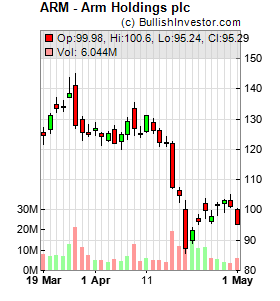 ARM
ARM
| Arm Holdings plc | 29,174,994 | $87.19 | $103.01 | $85.61 | $100 |
-16.90%
|
|